22 Continuous integration
Continuous integration (CI) is the practice of automating the integration of code changes from multiple contributors into a single software project.
22.1 Introduction to Continuous Integration
In COMP23311 so far, you have begun to use a number of modern software development tools that help us keep our code quality high, even when multiple developers are working on the same code base. We’re now going to introduce another class of tool: the continuous integration server.
As the name indicates, these tools have the job of continually putting a software system through the processes that lead to releasable software. A typical continuous integration server will:
- Integrate the various components of the system.
- Compile the code and create an executable version of the system.
- Run the unit tests, integration tests and acceptance tests.
- Generate reports on the quality of the system (for example, test coverage reports).
- Inform the development team when some part of the above process fails.
These steps will be undertaken at regular intervals, usually based on some automated trigger. Developers do not need to remember to request that it happens; the CI server takes care of it for us.
The aim of repeatedly going through this process is to discover problems early, well before the release deadline, so that there is plenty of time to correct them.
Before such tools came into common use, developers concentrated on their own parts of the system, building and testing them in isolation, until the release deadline approached. Only then would the whole system be compiled and integrated, and the tests run on the full code base. Inevitably, some of the tests would fail or, in the worst cases, some of the code would fail even to compile. With the deadline looming, the panicked team would have to find and fix the problems under pressure, often leading to more bugs being introduced and poor decisions being taken that could have been avoided if only the team had thought to integrate, build and test their code as they went along instead of at the last minute.
There is a lot to be said for building and testing code frequently. When we go through this process after just a few small changes have been made to the code base, it’s a fairly safe bet that the cause of any failing tests will be one of the changes we’ve just made. Even if our changes did not cause the error, something we have done has caused the error to become visible. In most cases, we’ll only need to examine these changes to be able to track down the root cause of the error. The problem can then be fixed fairly quickly, before other code changes in that area of the code start to happen and before other developers have made use of the same buggy code.
Contrast this with having to fix multiple interacting bugs at the same time, with the deadline looming, while the code gets messier and messier and we all get more and more frustrated and tired.
So, building and testing the whole system frequently, from the beginning of the project, is a good idea. The problem is that most programmers (being only human) don’t remember to do it. We build and test our own local version of the system easily enough: our IDE will continually check for compile errors, as we type, and it is fairly easy to get into the habit of building and running unit tests locally as we code. But how many of us will be willing to break off our chain of thought on a piece of code in order to integrate our work with that of other developers and to wait while lengthy acceptance test suites are run? Instead, the CI server takes on this task for us, only interrupting us when something has gone wrong.
Continuous integration servers typically run on separate shared machines that are set up to build and test the code as frequently as we like. We can set a timed schedule (e.g., to build every morning before our developers come in to start work) or we can ask for the build and test process to be carried out every time someone on the team pushes changes to the shared repository. This latter option is good if we can manage it, because if we have pushed code that breaks some aspect of the build and test pipeline, then we’ll get an almost immediate warning of that from our continuous integration server. We’ll receive an e-mail from the server, or else the server might be set up to push a notification to our team’s chat channel on Slack or Discord or MS-Teams, or to some other communication system.
That is what the CI server is doing for us on COMP23311. One of the best practices we try to follow in this course unit is that of maintaining clean releases. (We obviously don’t want to deploy code to the customer that has known faults.) The CI server helps with that by telling you about the problems with the code you push to GitLab within minutes of it appearing there. That means you can fix problems while they are still on your feature branches, and you can make sure that only clean code makes it through to the development branch or (most importantly) to the release tags.
For this course unit, we will use Jenkins (jenkins.io), a well-established CI server. We have set up a number of build jobs for you, that will show you the health of your team’s submission for the coursework exercises so far. This brief guide will show you how to use Jenkins to access information about the build health of your team, and how to interpret the reports it provides.
22.2 Logging onto Jenkins CI Server:
You can login to the Departments Jenkins continuous integration (CI) server at ci.cs.manchester.ac.uk/jenkins. This will take you to a login screen. Enter your University username and password into the form and press Sign in.
You should now be taken to the main Jenkins “dashboard”, showing the folder we have created to contain your build jobs for the COMP23311 team coursework this semester, which should look something like figure 22.1
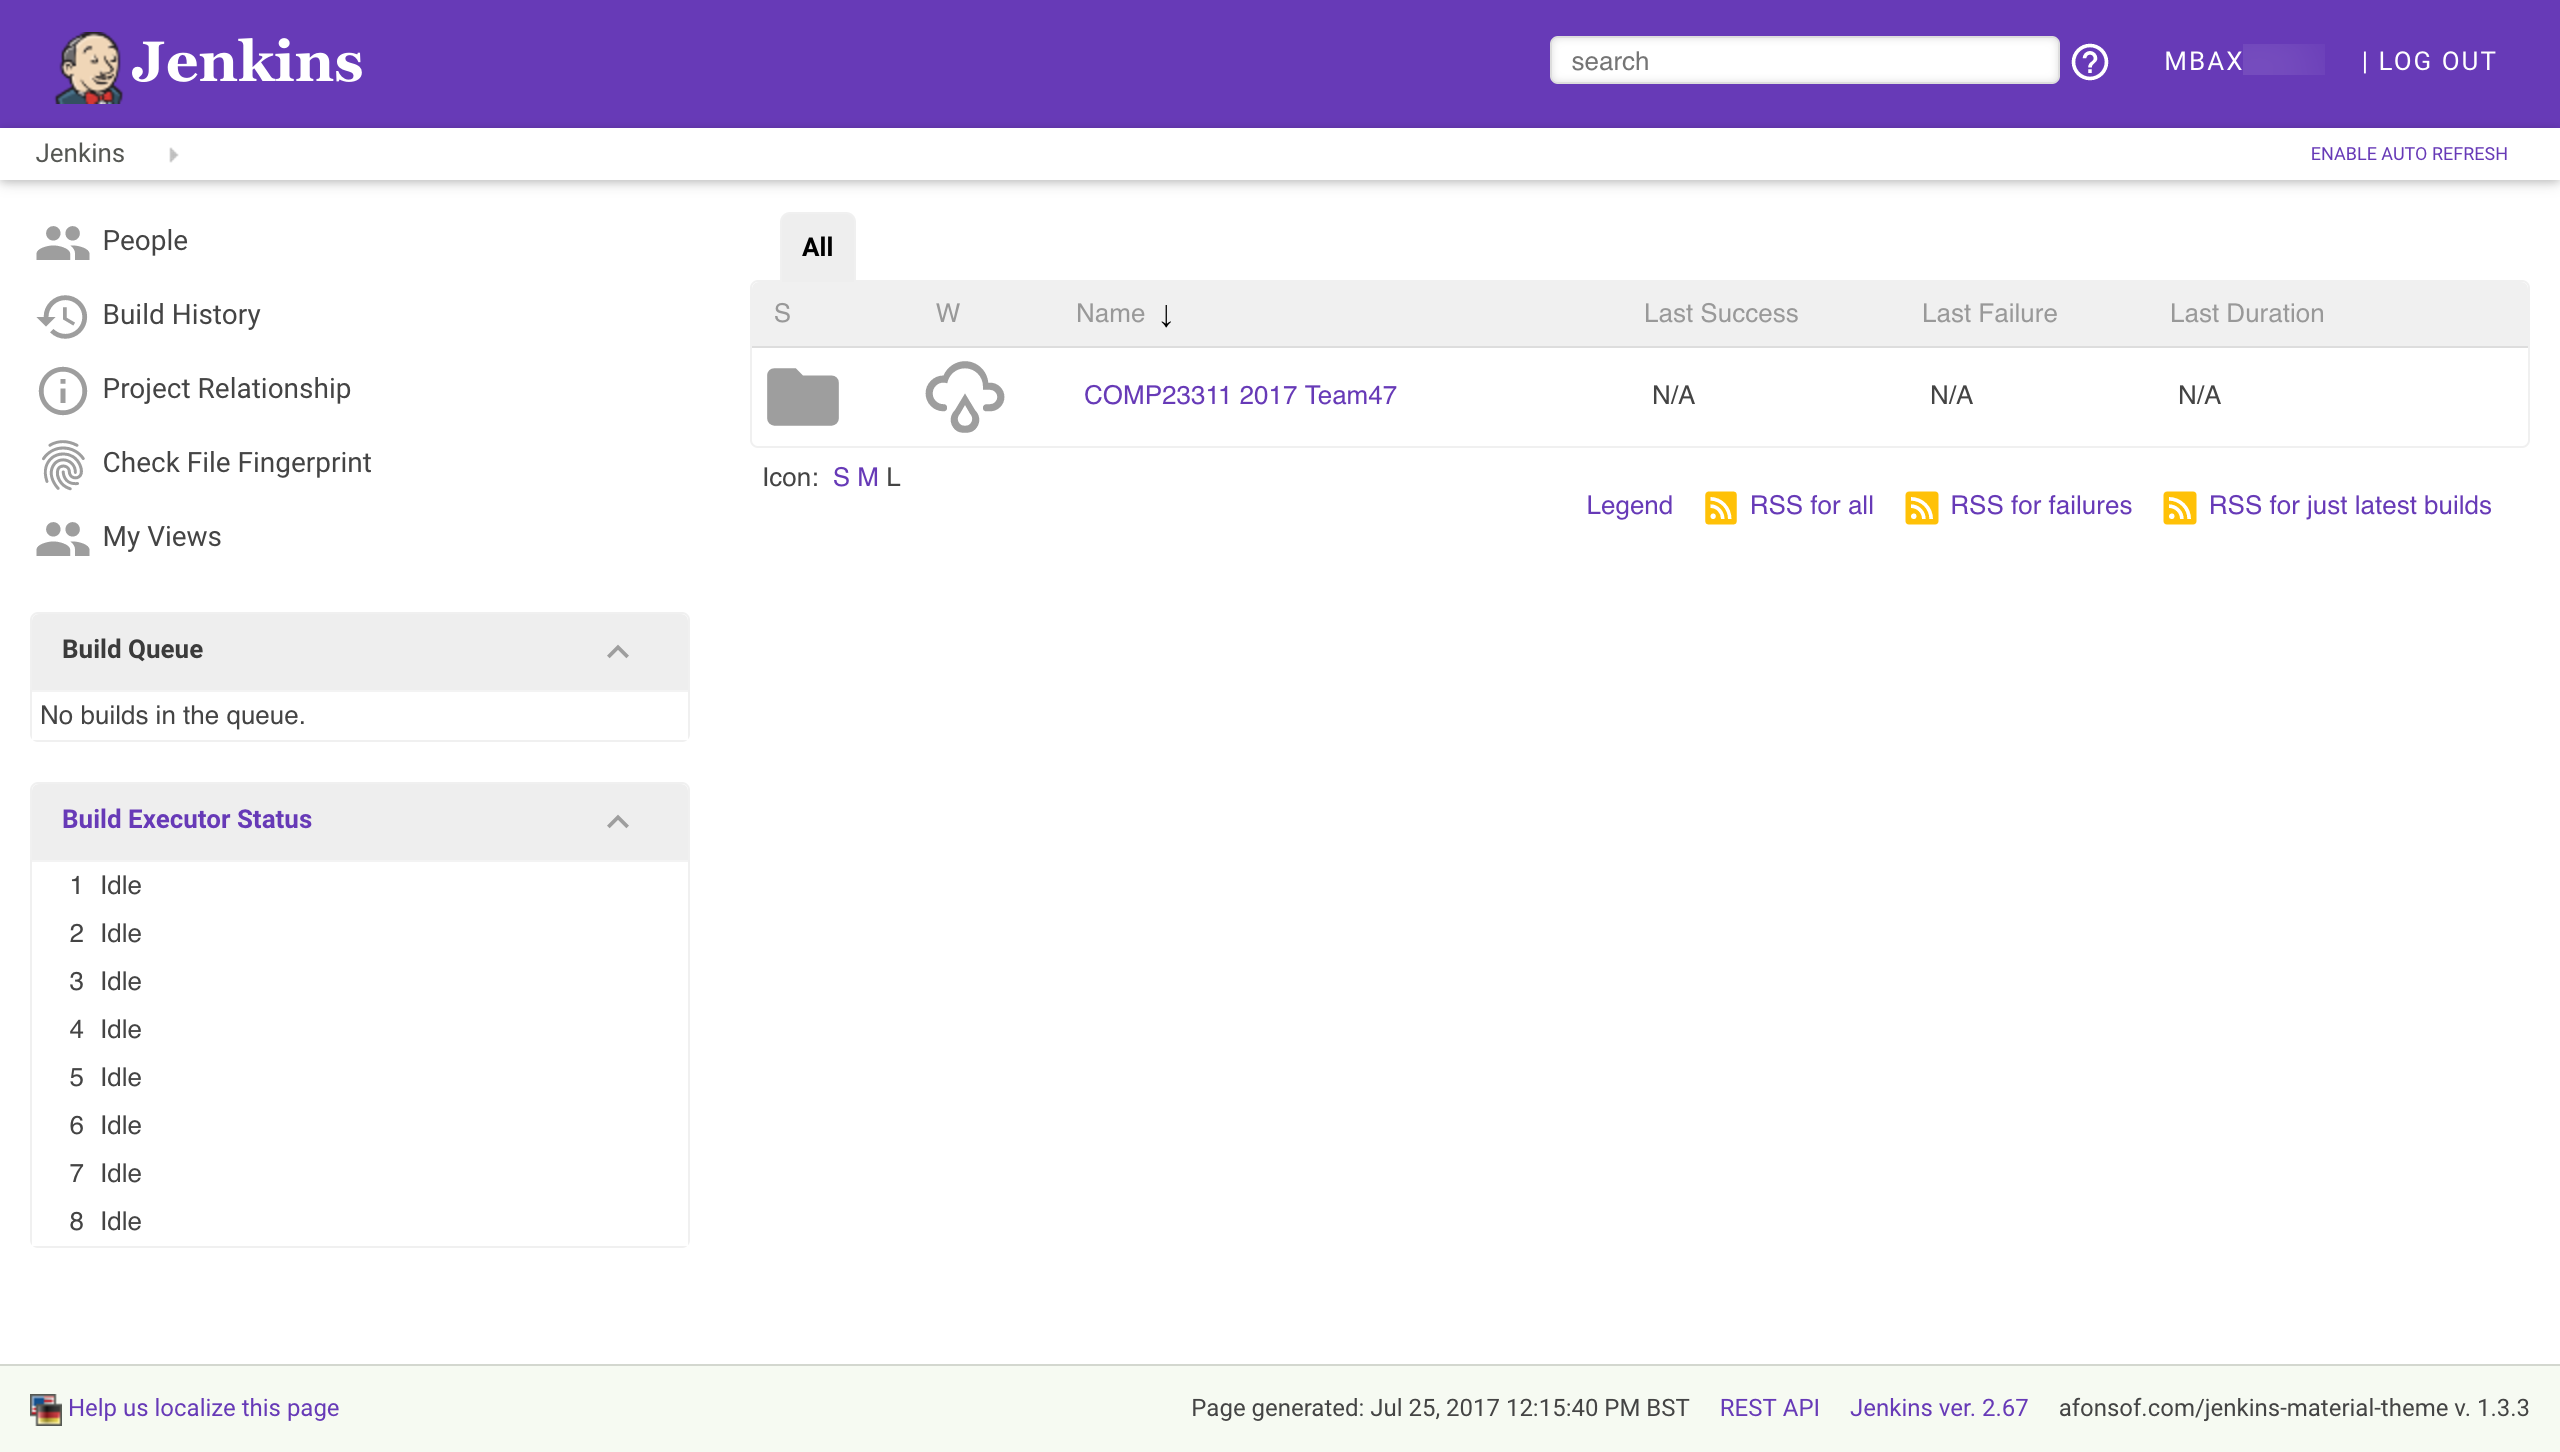
Figure 22.1: The main Jenkins dashboard
There are various features to note about this screen. On the left is a menu of basic commands, and below this is some information about what builds Jenkins is currently running. We have set the Jenkins server up so it can run a number of builds in parallel (exactly how many varies from year to year, with the resources we have available). If more build jobs than this are requested at any time, some of the jobs will be show in the Build Queue, waiting for a build executor to become available. You will only be able to see build information for your own team’s jobs, and often Jenkins will be occupied building jobs from other teams, so at busy times (for example, in the days before a coursework deadline) your team’s build jobs may be stuck in the queue for anything from a few minutes up to several hours.
On the right of the dashboard, you can see a list of the top-level jobs and folders you have access to. At the moment, the only thing you can see is the folder for your work on COMP23311. The grey folder icon indicates that this is a folder and not a build job. Next to it, you can see an icon indicating the “weather” for this set of builds. That is, it shows the status of the builds within the folder over recent builds. A stormy weather icon indicates that the builds in this folder are failing, and have been for some time. In contrast, a sun icon would indicate that the builds in the folder are all succeeding. Figure 22.2 shows some of the build health icons, and their meanings.

Figure 22.2: A range of icons indicate the health of a build. From left to right: A rain icon is used to indicate that between 20% to 39% of builds were successful. A cloud icon: 40% to 59%. An overcast icon: 60% and 79% of builds were successful. A sun icon indicates that greater than 80% of builds were successful.
You can get more information about the health of an item by hovering over the weather icon in Jenkins shown in figure 22.3.
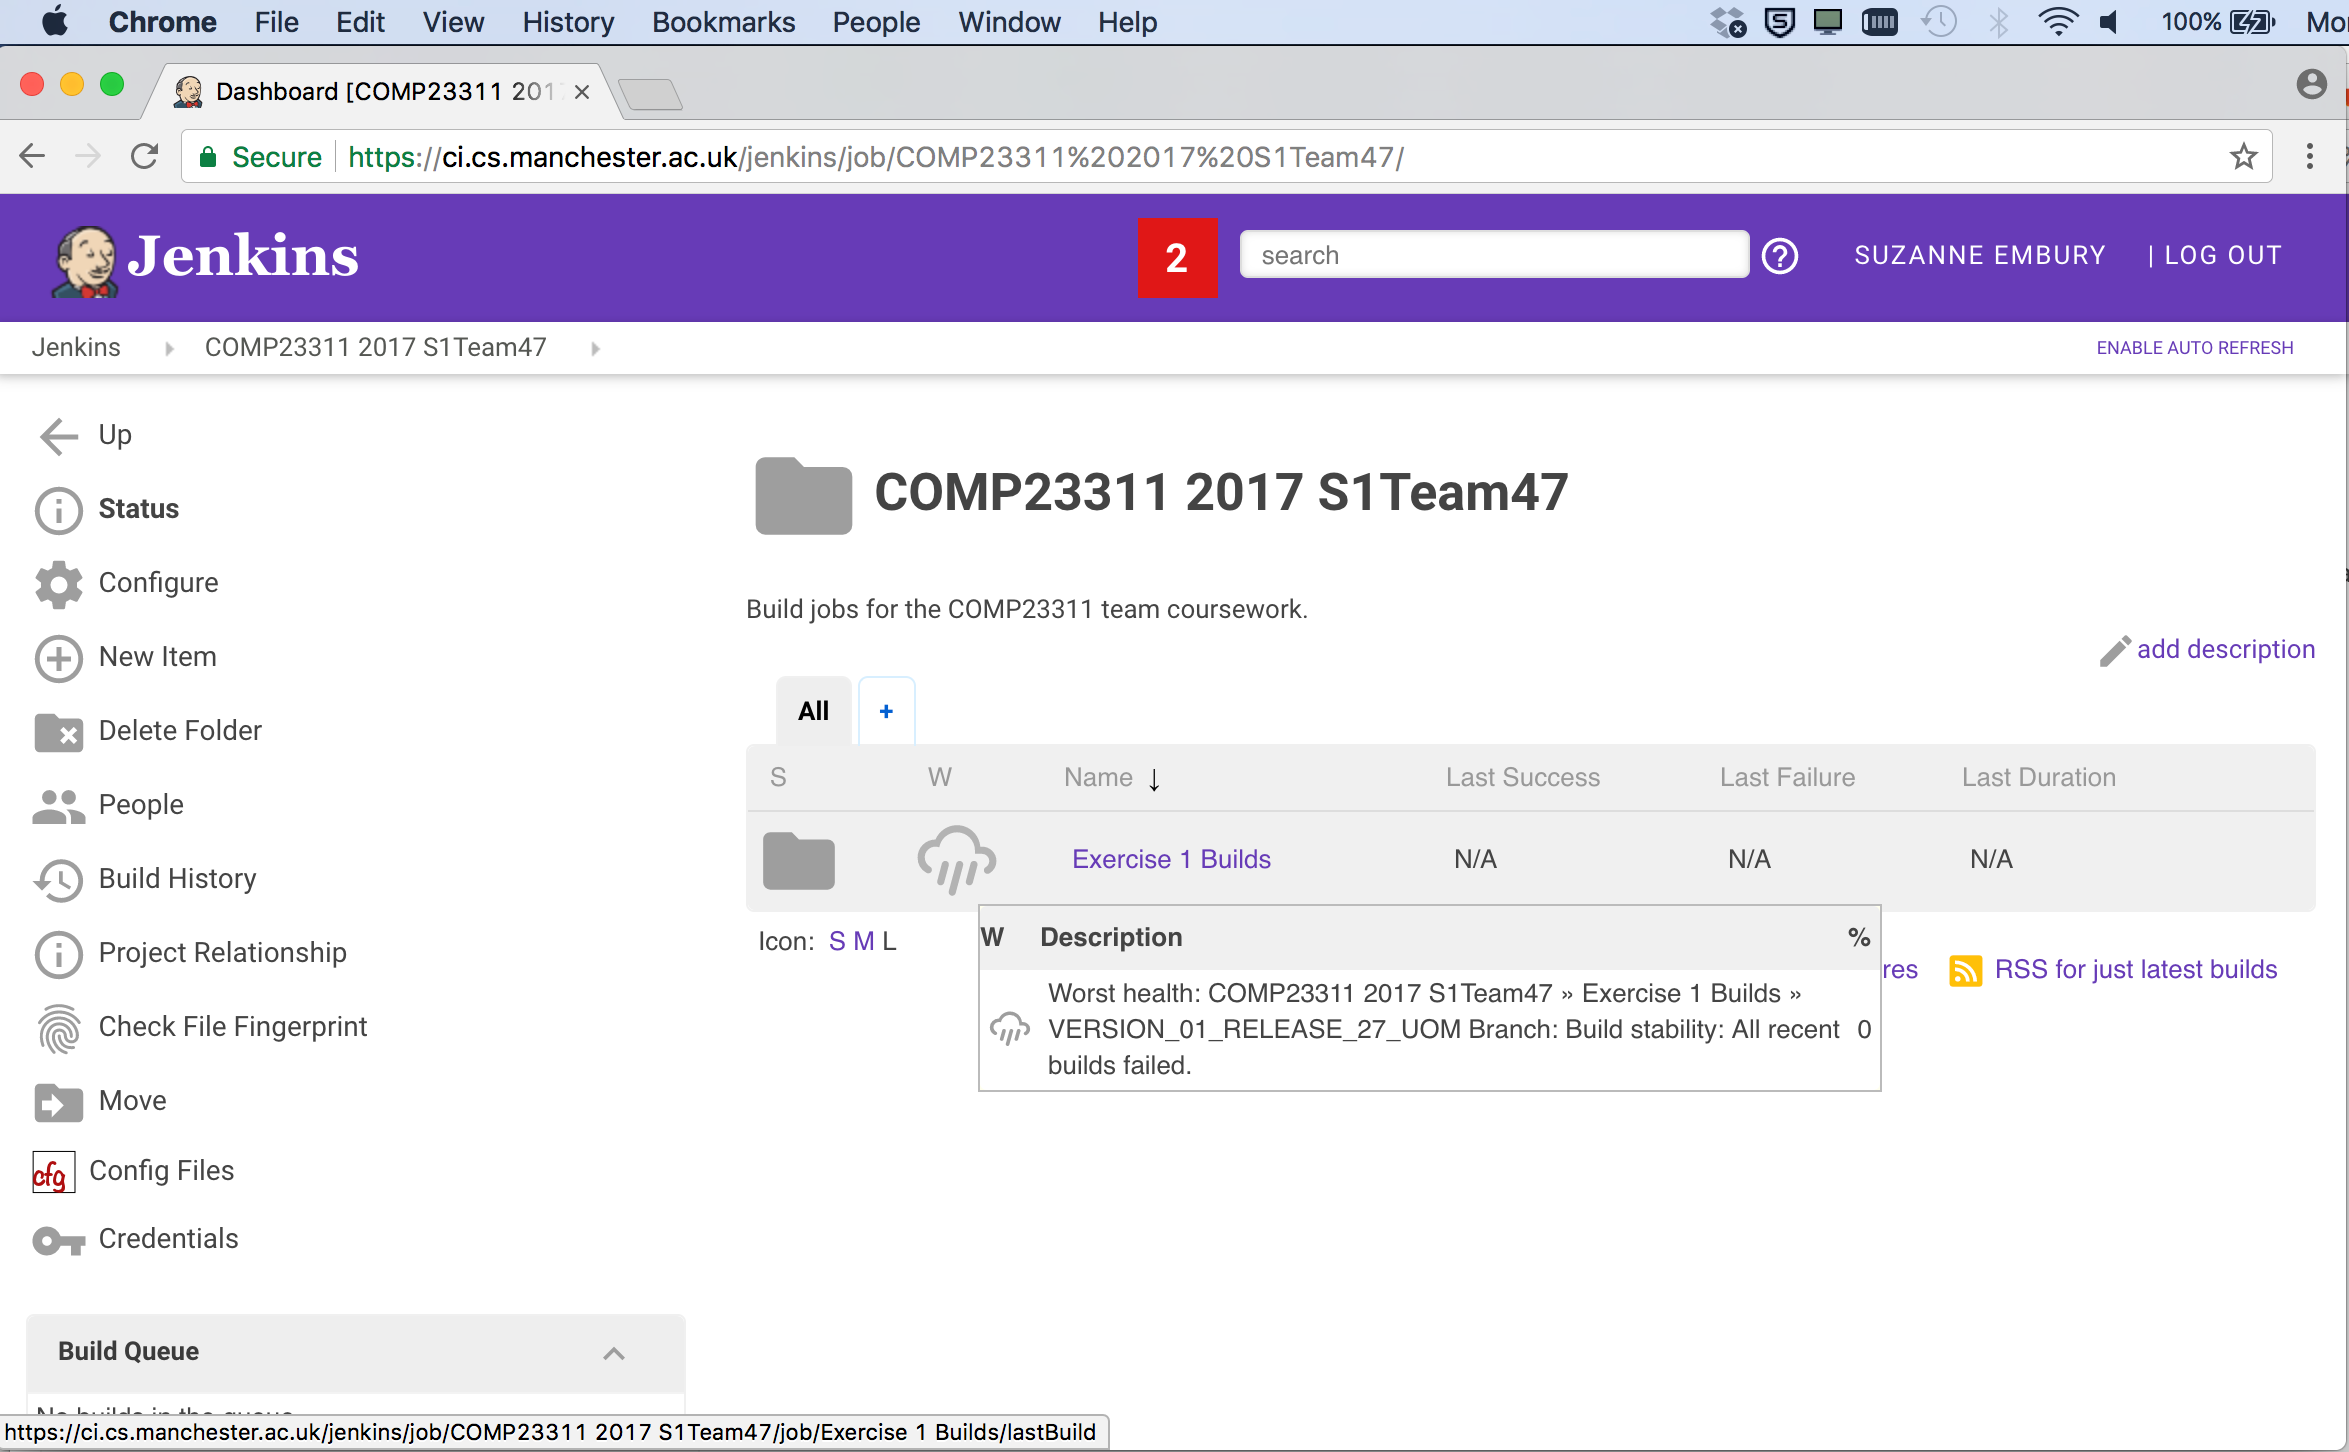
Figure 22.3: Hovering over an icon will display a tool tip that gives more information about what the icon means in terms of the build.
As you can see, the tool tip gives more information about the build health, and also indicates the worst performing build within the folder. This is really useful for diagnosing problems, and finding branches that need extra attention.
Team 47 doesn’t have a great build health at the moment, but they still have time to improve their build “weather” before the coursework deadline. Take a look at the weather status of your own team’s build folder. As you complete the coursework and your builds move from red to green, your build health icon should become sunnier.
22.3 Accessing your Coursework Builds
Next, we’re going to look at the builds that have been set up for your exercise 1 coursework.
Click on the link for your team’s COMP23311 folder. This will show you a list of the builds and folders that have been created for your team for this course unit shown in figure 22.4.
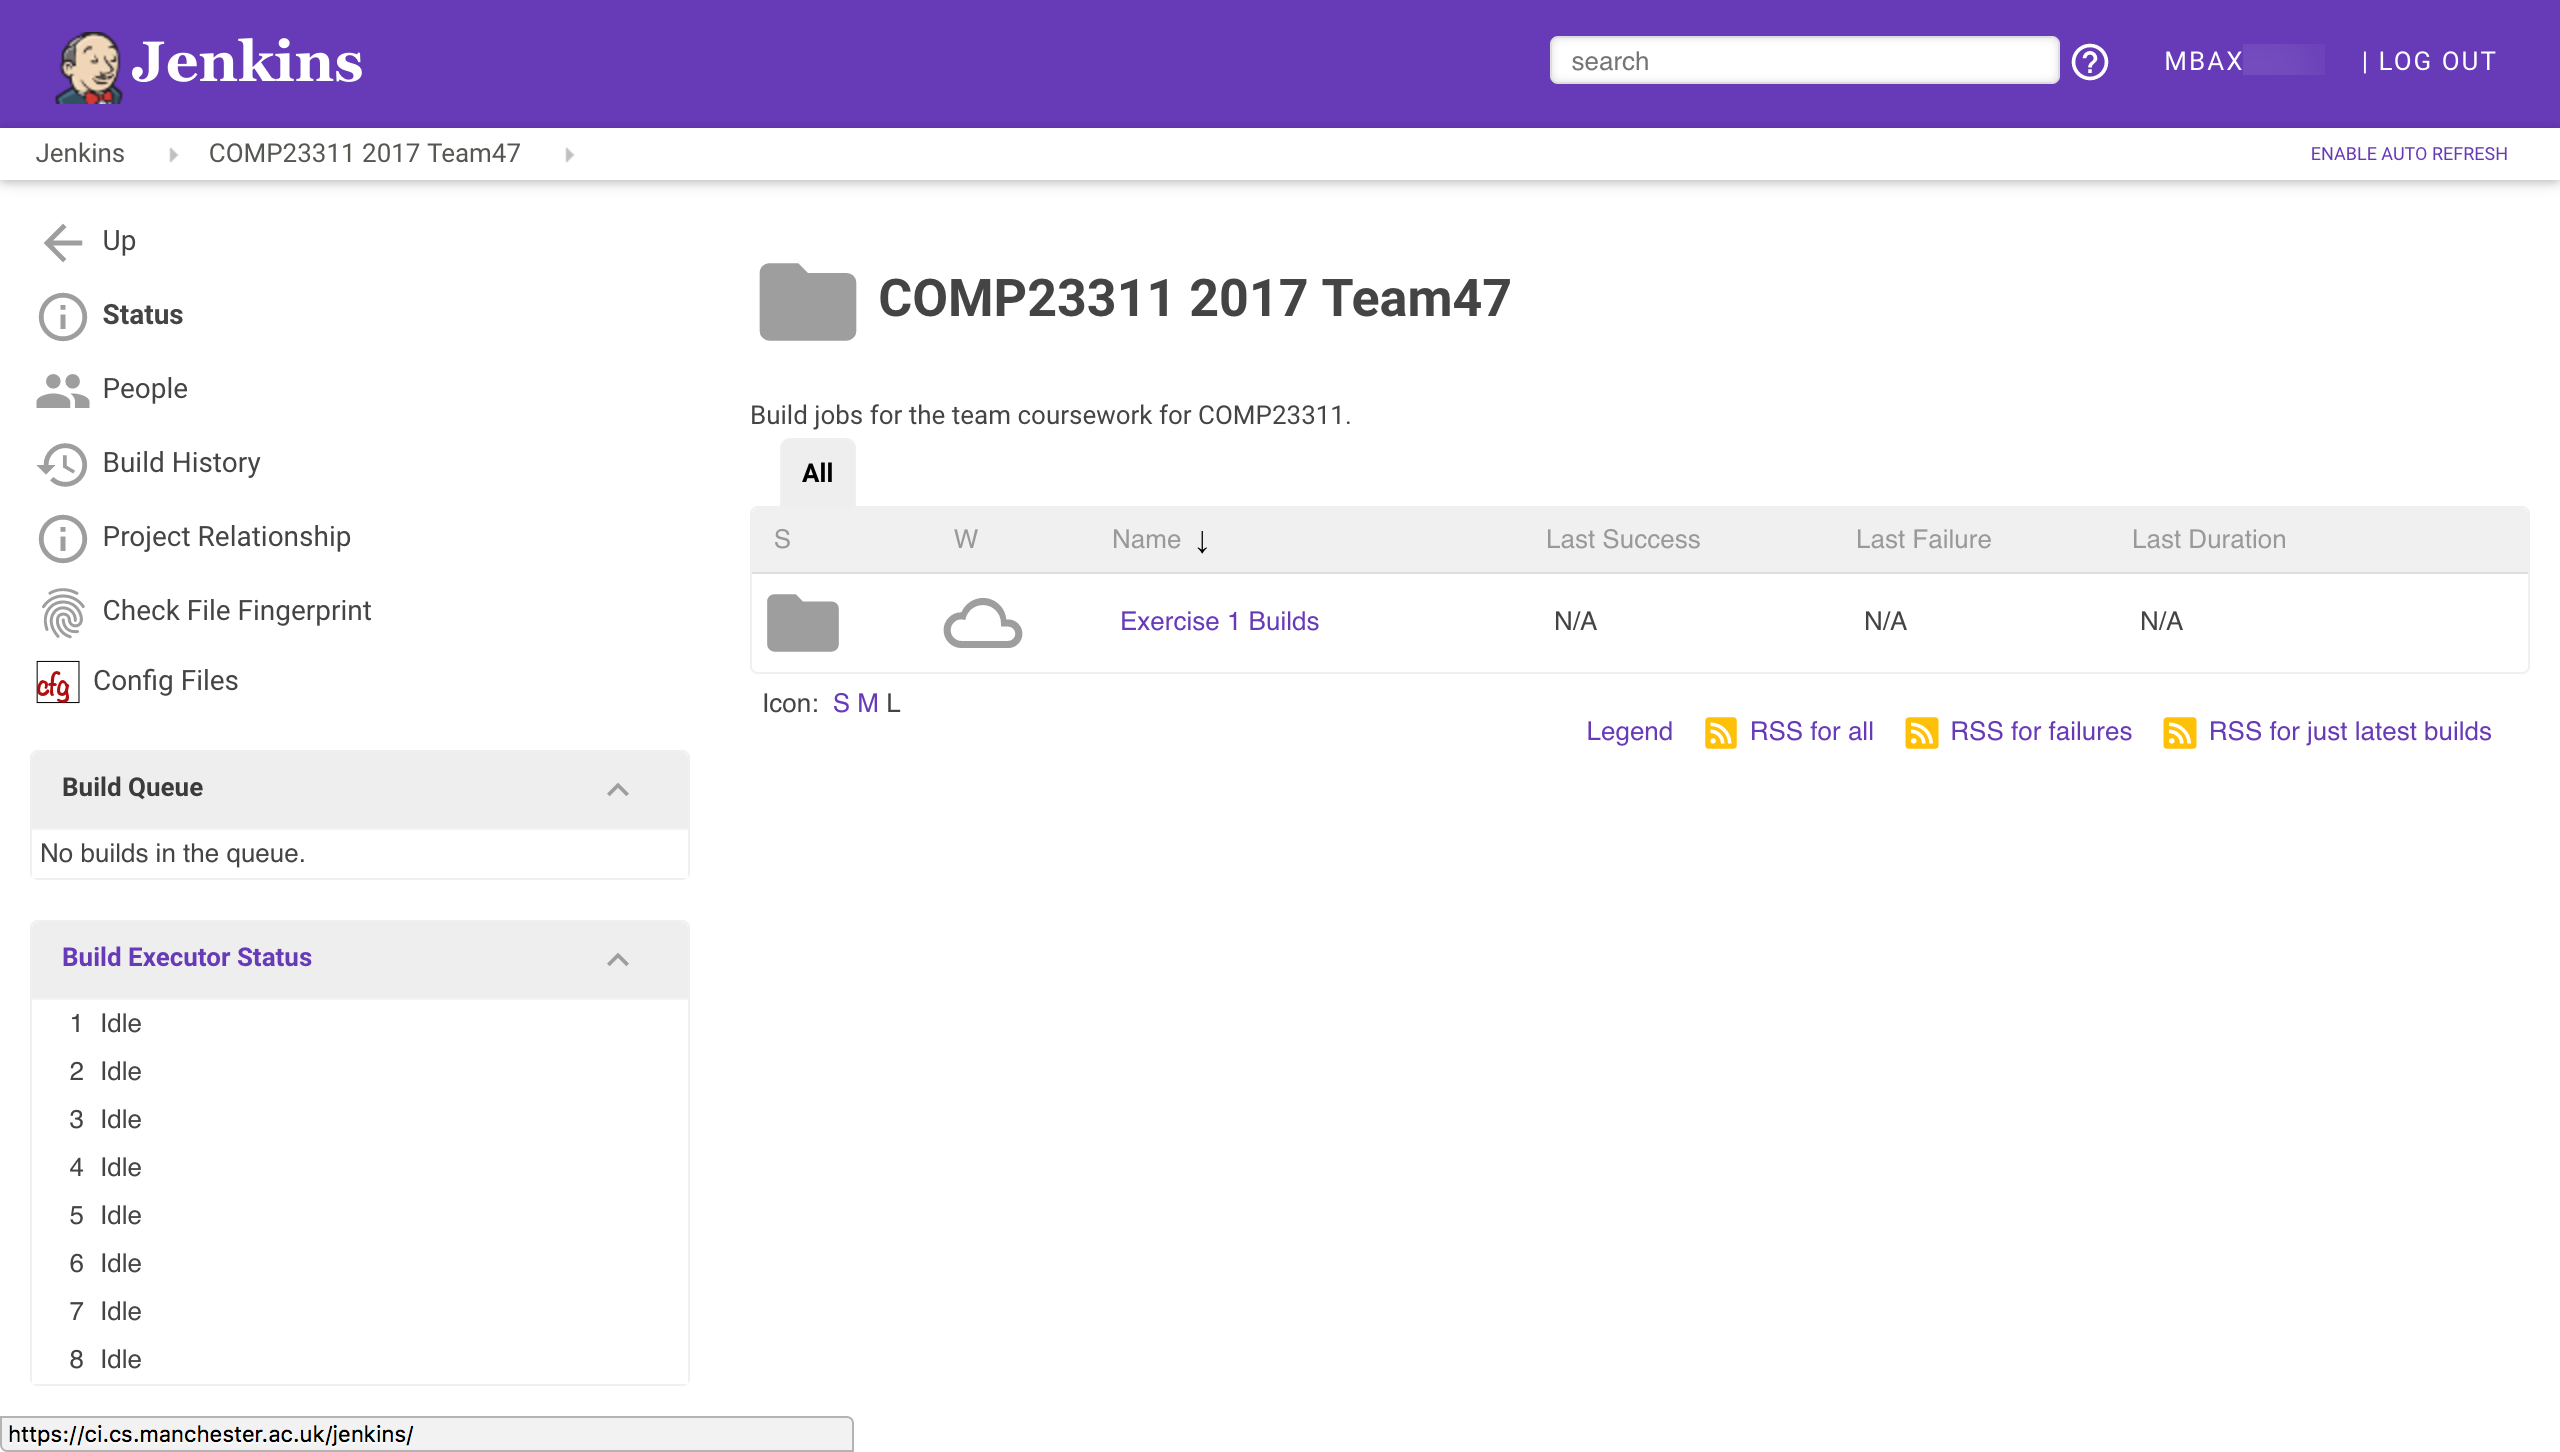
Figure 22.4: An example of how a teams coursework builds look in Jenkins
At this stage in the course unit, only builds for exercise 1 have been set up. Later, more folders and jobs will appear here, as the coursework progresses.
This year, you will see an additional project in your team’s folder. This job creates and stores the reports on your work created by the RoboTA automated feedback and marking system. To see how your team is doing on the coursework so far, click on this job and then selected the Team Marks and Feedback report.
We’ll now take you through the builds we have set up for your team for team coursework exercise 1. Click on the Exercise 1 Builds folder link. This will take you to a Web page showing the following builds as in figure 22.5
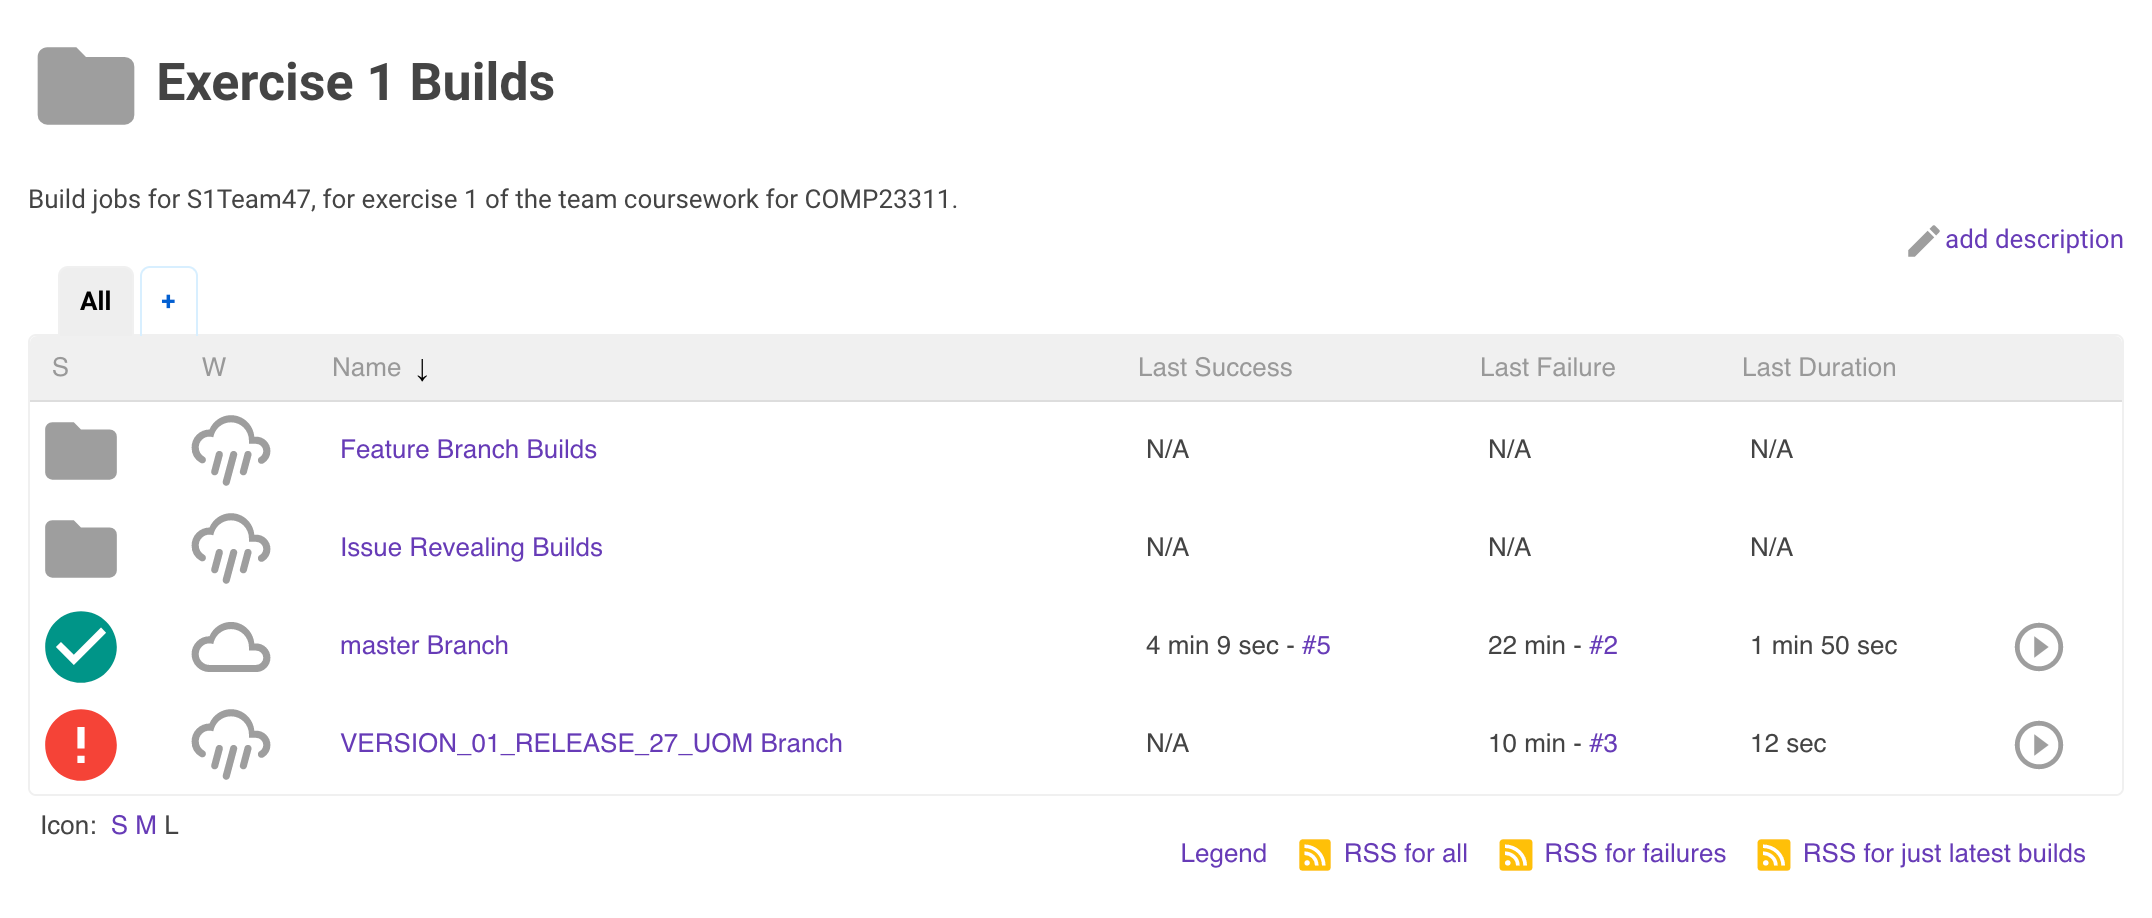
Figure 22.5: An example of the contents of the Exercise 1 Builds folder displayed in Jenkins.
On this page, you can see the summaries of some actual builds, instead of just folders. We have set up Jenkins projects to build the important code versions for this coursework: the development branch (master) and the release tag (VERSION_01_RELEASE_27_UOM) for the team in this screenshot—your team will use a different release tag).
Your team will also have an additional build, not shown in this screen shot, for a tag called COMP23311_EX1_STARTING_POINT. This shows you the build health at the start of the coursework.
Instead of a folder icon, build jobs have coloured icons indicating whether the most recent build was successful or not. The red exclamation mark beside the release branch project shows that the latest build for this tag was unsuccessful. Some error occurred during the build process that meant that executable code could not be produced. This could be caused by a compilation error in the code, but it could also mean that the tag or branch to be built doesn’t yet exist in the team’s GitLab repository. Builds of this kind are called failed builds.
The yellow icon beside the development branch build in the figure shows that the build process itself succeeded but that some of the unit tests failed. A build like this, where executable code was created and could be run, but some other later check failed, is called an unstable build.
In total, there are four build status icons that you might see in Jenkins, shown in figure 22.6. The goal for most of our builds is to get a green build icon beside them. This indicates a successful build: there were no compilation errors, the Ant build file was executed successfully and the unit tests all passed. This kind of build is called a stable build.
The final type of build icon is grey, and this simply indicates either that no builds have yet been attempted for a particular job or that the last build was aborted before it could complete. If no one in your team has pushed code to your repository since the Jenkins builds were created, then all your exercise 1 builds will be grey. This will change as soon as some code changes are pushed.

Figure 22.6: Four build status icons you might see. From left to right: 1. Grey no entry sign (Not built) build not yet attempted or build aborted. 2. Red exclamation mark (Failed build) the build process could not be completed. 3. Amber exclamation mark (Unstable) build succeeded but some tests failed. 4. Green tick (Stable build) build process succeeded and all tests passed.
To the right of the build job names, Jenkins gives some information about the previous builds. It tells us how long ago the most recent successful build was (either stable or unstable) and how long ago the most recent failed build was. It also gives a link to information about that build. Here, five builds have been carried out for the development branch, so the link to the most recent successful build is to build #5, while the most recent unsuccessful build was build #2.
Jenkins also gives the duration of the last build. This is important on real systems, as if builds are taking too long then it could indicate a problem with the system. In addition, the length of a typical build affects how long programmers need to wait to get feedback on their pushes. Experience has shown that programmers will wait for a few minutes for information on the status of their build, but if they have to wait much longer than 10 minutes, then they will change their focus to another task, and lose the context needed to efficiently fix problems that may be revealed by the build. So it is important that build times are kept under control.
Manually Requesting a Build
The buttons in the final column allow you to manually request that a build of the job be scheduled (as opposed to waiting until someone pushes new code to your GitLab repository). Try pressing the button next to any of the build jobs now. You should see the text Build Scheduled appear over the button, and (shortly) the job will appear on one of the Build Executors (or in the queue, if you request the build at a busy period).
When the build completes, the summary of builds for this job should be updated. You may need to refresh your browser window to see the new information.
22.4 Drilling Down on the Development Branch Build
Next, we’re going to drill down into the information Jenkins provides about individual build jobs. We’ll look at the development branch build first, and will come back to look at the contents of the Feature Branch Builds folder later.
Click on the build job link for the master branch. You should be taken to a page that looks similar to figure 22.7.
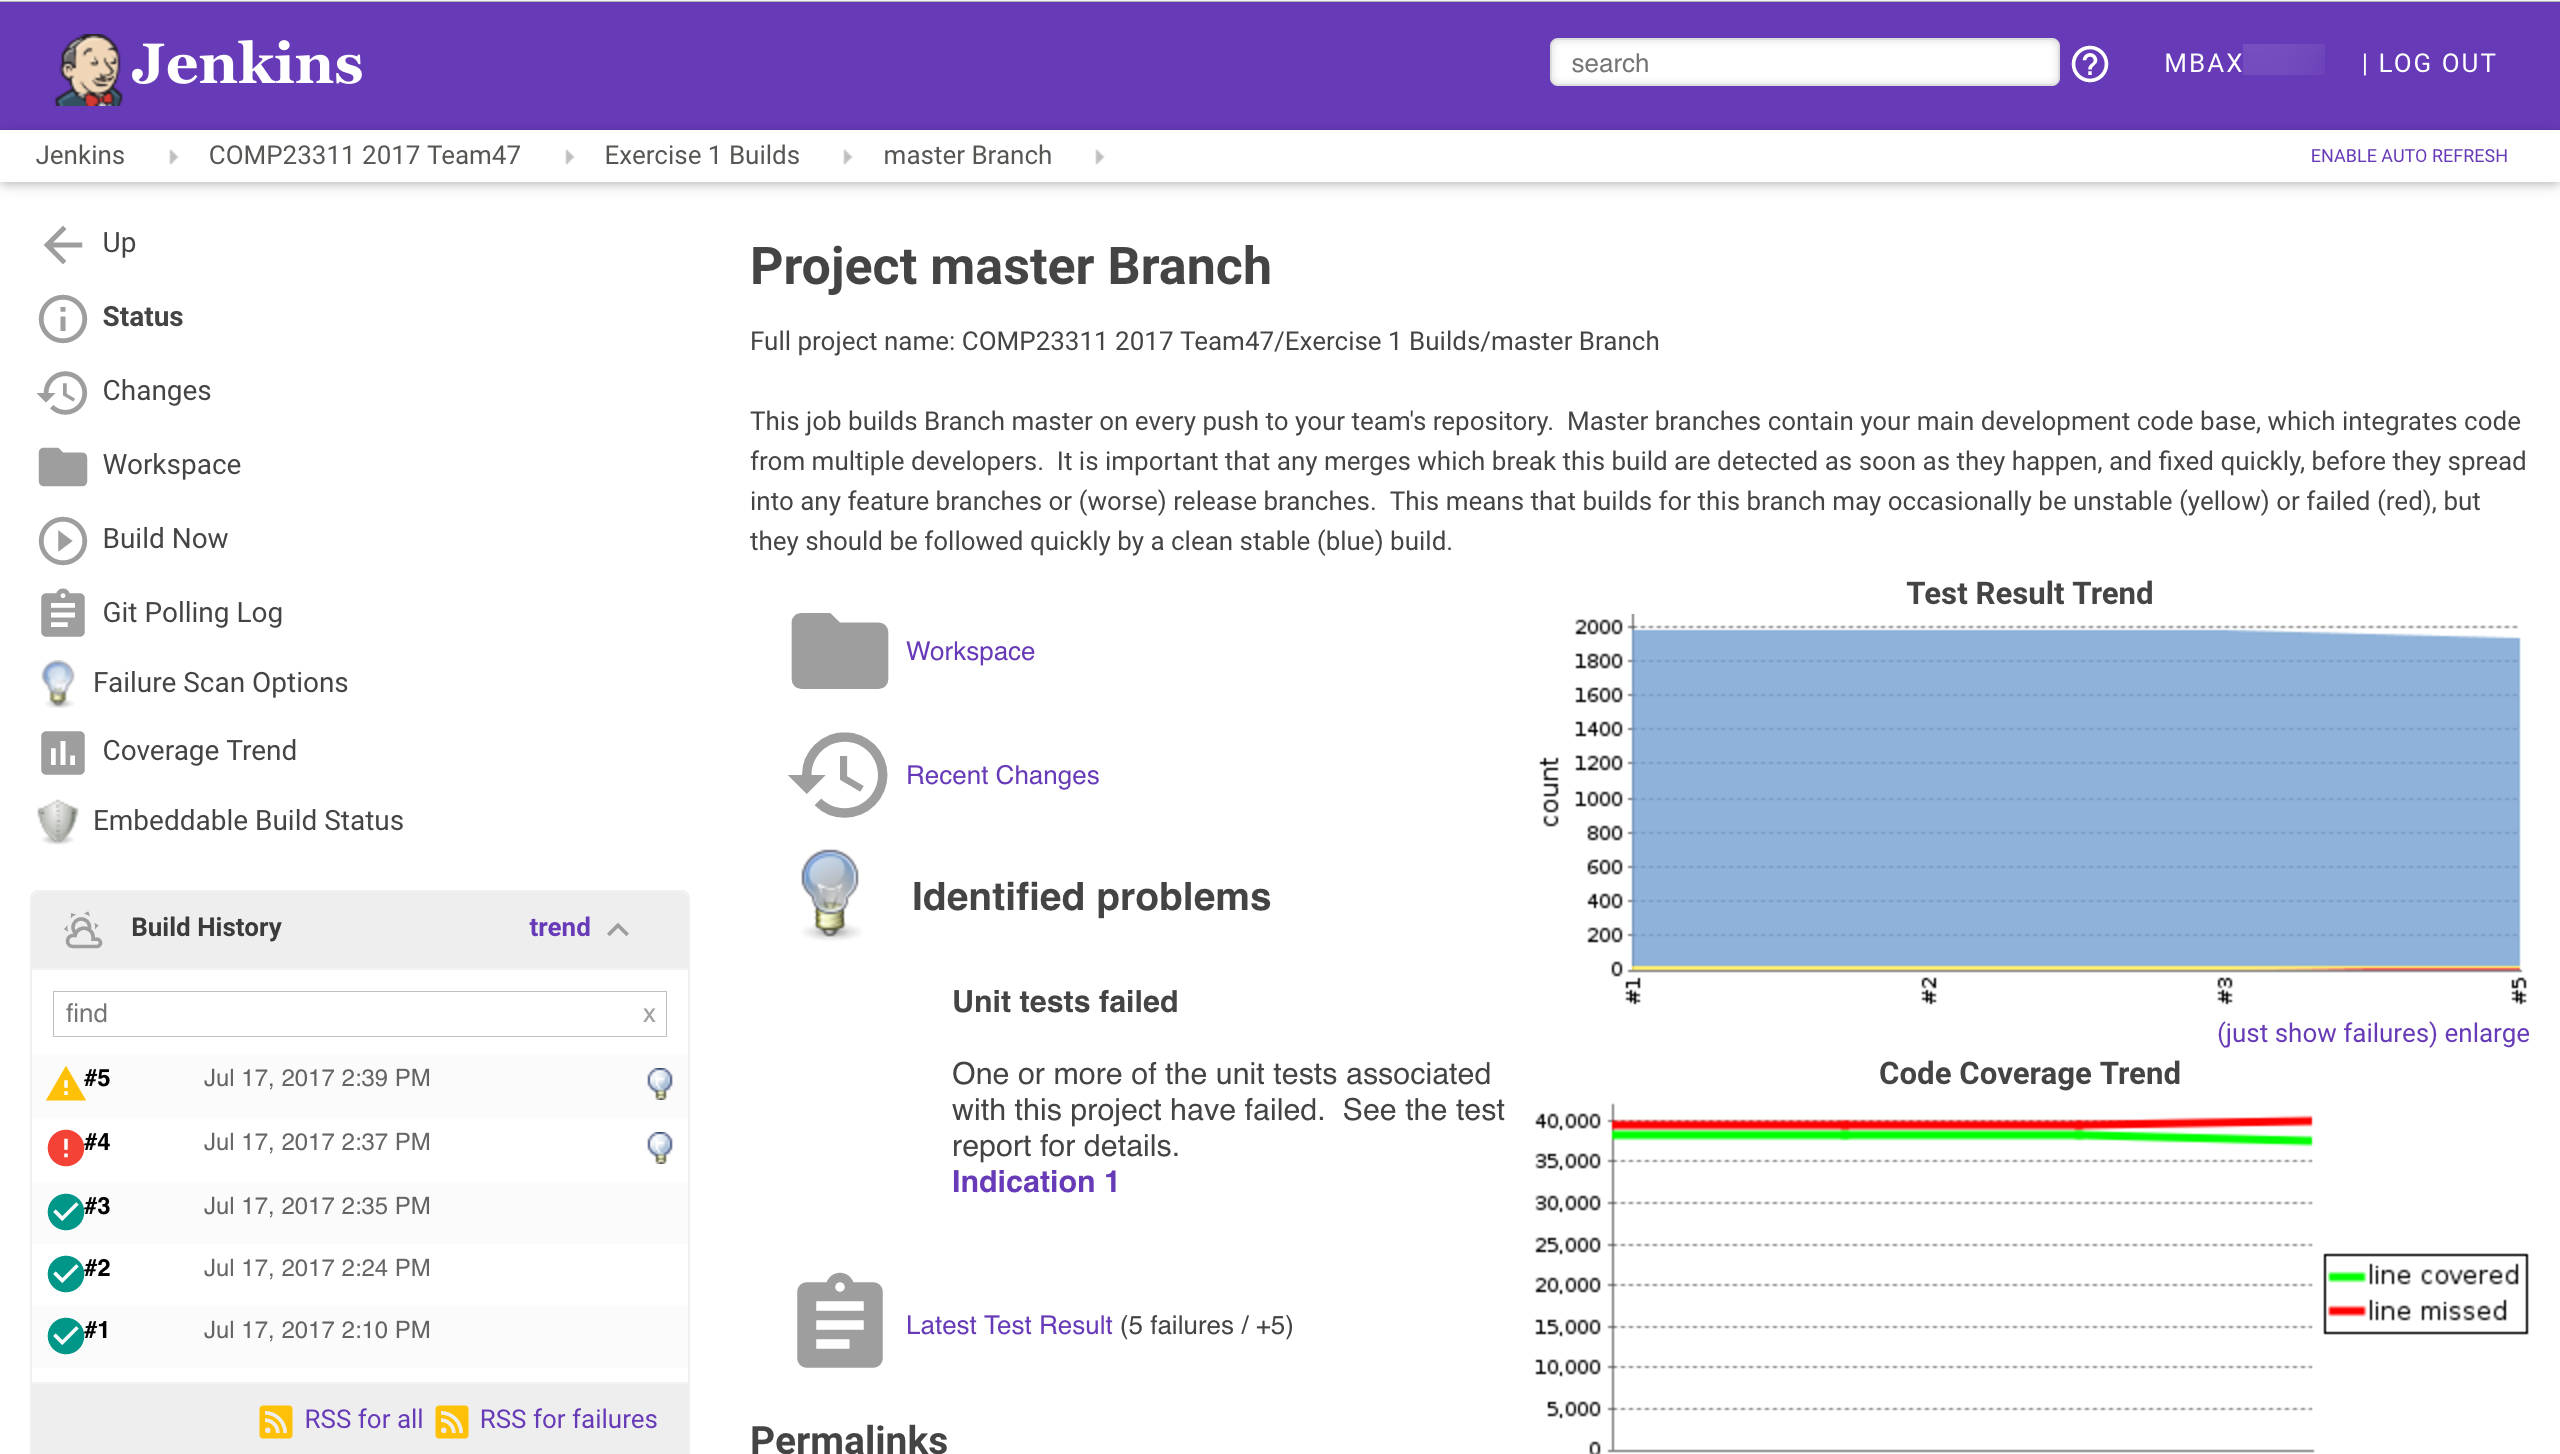
Figure 22.7: Jenkins view of the master branch
Figure 22.7 is the main page for the build job we have set up for the development branch of your team’s repository. It gives a summary of the most recent build status for the job, and also information about the build history. Let’s take a look at the information and options provided by it.
At the top, below the purple Jenkins banner, you can see some breadcrumbs showing the parent folders for this particular job. The names are all clickable links.
Just below this, on the left, there is a menu showing the things you can do with your build job. Some of the buttons are links to further information about the build, and some are commands that you can issue. Note, for example, the presence of the Build Now option, which gives another way to manually request that a build of this job be scheduled.
On the bottom left, you will see a table showing the build history for the job. Each row summarises a past build attempt. The status of the build is shown (by the coloured ball icon), followed by a link to the detailed build report and then the date and time at which the build took place. Finally, all non-stable builds should end with a light bulb icon, indicating that the cause of the build failure has been analysed, and information about it has been added to the build report. Hovering your mouse over the light bulb will give an indication of what went wrong.
On the remainder of the page is information about the status of the most recent build, including links to various reports produced during the build. The first is a link to the workspace (i.e., filespace) used for the most recent build, and the second to information about the code changes that triggered the build.
Under the section headed Identified Problems (with the light bulb icon 💡) you will see a description of what caused the build to fail or to become unstable. In this case, the code was able to compile successfully. The problem is that some of the test cases have failed.
Next comes a link to a build report (indicated by the grey clipboard icon). In this case, it is a report produced by JUnit when the build was last run. The summary tells us how many tests failed in the build and (importantly) gives information about the change in test failures that occurred in the most recent build. In this case, the summary 5 Failures / +5 indicates that five tests are failing in total, and that all five failures appeared in this recent build (this build added five failures). This is useful information as test failures that appeared in a build are likely to be caused by the changes that were pushed to the GitLab repository and that triggered the build. Test failures that first appeared in older builds will not have been caused by anything we have just done to the code.
You can click on the Latest test result link for information about which tests failed and why.
Two other build reports are shown on this page: the two graphs on the right hand side of the page. The one at the top shows the test results trend over the course of recent builds. The blue line shows the number of tests that pass, the yellow line shows the number of tests that have been skipped (using the @Ignore annotation) and the red line (the important one) shows how many tests have been failing. We can just see a slight increase in the number of failing tests for the latest build (plus a corresponding decrease in the number of passing tests).
The graph below shows the code coverage trend, produced from the JaCoCo coverage reports from recent builds. Coverage for this team has been fairly stable, with a slight drop in coverage in the most recent build, caused by the failing tests. (It is normal for coverage to drop a little when tests fail, since not all the test assertions will be executed and therefore some lines will not be covered. A significant decrease, however, could indicate that your tests are too bulky, and should be separated out into a larger number of smaller, more independent unit tests.)
You can click on any of these build reports to get more detailed information about the results of the most recent build. You can also click on individual builds in the Build History, and see copies of the reports as created at the time of the build. You can even see a copy of the console output that was produced when the build was run.
22.5 What Happens When Jenkins Builds a Job
It is all very well to have all this information at our fingertips, but it is only useful if we understand where it comes from. So, now we are going to look at what happens when Jenkins performs a build of some job.
22.5.1 What Triggers the Build?
The first question to answer is what causes Jenkins to start to perform a build for some job. We have already seen that we can manually schedule a build, using the Build Now command or button. But that relies on us, the developers, remembering to request that a build be done. As we saw at the beginning of this exercise, the whole point of continuous integration servers is that we don’t have to remember to request a build. It should be done automatically, whether we remember or not.
Jenkins builds can be triggered automatically in a number of ways. For example, we can put a schedule in place that causes the job to be built every hour, or every 6 hours, or every 15 minutes, as best suits our needs at the time.
But probably the most popular way of triggering a build is to set up a web hook that causes Jenkins to build a job whenever someone pushes new code (or changed code) to the team repository. This is how we have set up your team repository. Whenever you push code changes to your repository, GitLab sends a notification to Jenkins about the change. Jenkins then uses this information to trigger any jobs that use the repository that was changed.
Keep an eye out for this the next time you or anyone on your team pushes code changes to your team repository. As soon as the push is made, take a look at the Jenkins dashboard and wait to see if a build is triggered.
Triggering Builds Without a Code Change
Jenkins can be set up to trigger on all kinds of GitLab actions, including commenting on an issue and creating a tag. However, when Jenkins detects that one of the triggering events has happened, the first thing it does is to check that something has changed in the code base. If there are no changes to the code, there cannot be a different build outcome, so Jenkins saves time by ignoring the triggering event.
This is sensible behaviour most of the time, but is sometimes a bit of a nuisance. For example, if we have a build job set up for a tag, we might expect Jenkins to notice when the tag is created and to rebuild the job. Jenkins can indeed notice the tag appearing, but since such a change involves no new commits, it will not trigger a rebuild. In these cases, it will be necessary to request a build manually.
You’ll encounter this issue with the builds for your release tags. When you’ve prepared your team’s release, you’ll add the required release tag to the commit. But Jenkins won’t build your release tag project at this stage. You’ll need to manually request the build to check whether your release build has good health.
22.5.2 The Jenkins Workspace
When a job is triggered (and code changes have occurred), Jenkins uses a GitLab plugin to connect to your team’s repository and to create a clone of the whole repository in the workspace set aside for the job.
It then checks out the branch that has been specified to be the focus of the build.
At this point, Jenkins has created a directory folder in its own internal space, with a copy of your team’s code base that mirrors the one you have on your machine. (It obviously doesn’t have any files or changes that you have not yet pushed to your team’s repository.)
22.5.3 Jenkins Runs the Ant Build
Once we have a copy of the code in the workspace, Jenkins attempts to build an executable from it. It does this in exactly the same way we have practised in the workshops: it calls Ant and invokes the dist target in the build.xml file within the workspace.
This is done within a shell. Jenkins records all the outputs from running the build script in the shell, and stores this with each build, for later diagnostic purposes.
We have also set the Jenkins jobs up to run the unit tests. Once the build is complete, Jenkins will invoke the test Ant target, in order to cause the unit tests to be run, and the coverage information to be gathered — in exactly the same way that these things happen when you run the Ant script from within your IDE.
Digression (Not Examinable)
There is one difference in the way Jenkins runs the unit tests. The machine on which Jenkins is running is a headless server. There is no graphics console attached to it. It sits in a machine room, rather on someone’s desk and is operated remotely through the terminal rather than through a graphical interface with a mouse or a trackpad. This means that any test cases that exercise the GUI of the Stendhal game system will fail, because no graphical display is configured for the machine. We get round this by running Xvfb, the X Virtual Framebuffer, before running the unit tests. This creates a virtual graphical display — or just enough of one — to allow the unit tests that exercise GUI elements to function as they would on a normal desktop machine.
22.5.4 The Results are Published
The final step in the Jenkins build process is to publish any reports created during the build process so that they can be accessed from the build web pages. This happens for the JUnit test results and the JaCoCo coverage results. If we had not configured your builds with publishing steps for both of these, then the graphs and web page test results would not appear on the build web page.
22.6 A Look at Feature Branch Builds
This almost concludes our tour around the Jenkins builds we have created for you to use with your work in exercise 1. We’ll finish with a look at the contents of the Feature Branch Builds and the Issue Revealing Builds folders.
In your browser, click on the breadcrumb for the Exercise 1 Builds. Then click on the link for the Feature Branch Builds folder.
You should be taken to a web page containing something like figure 22.8.
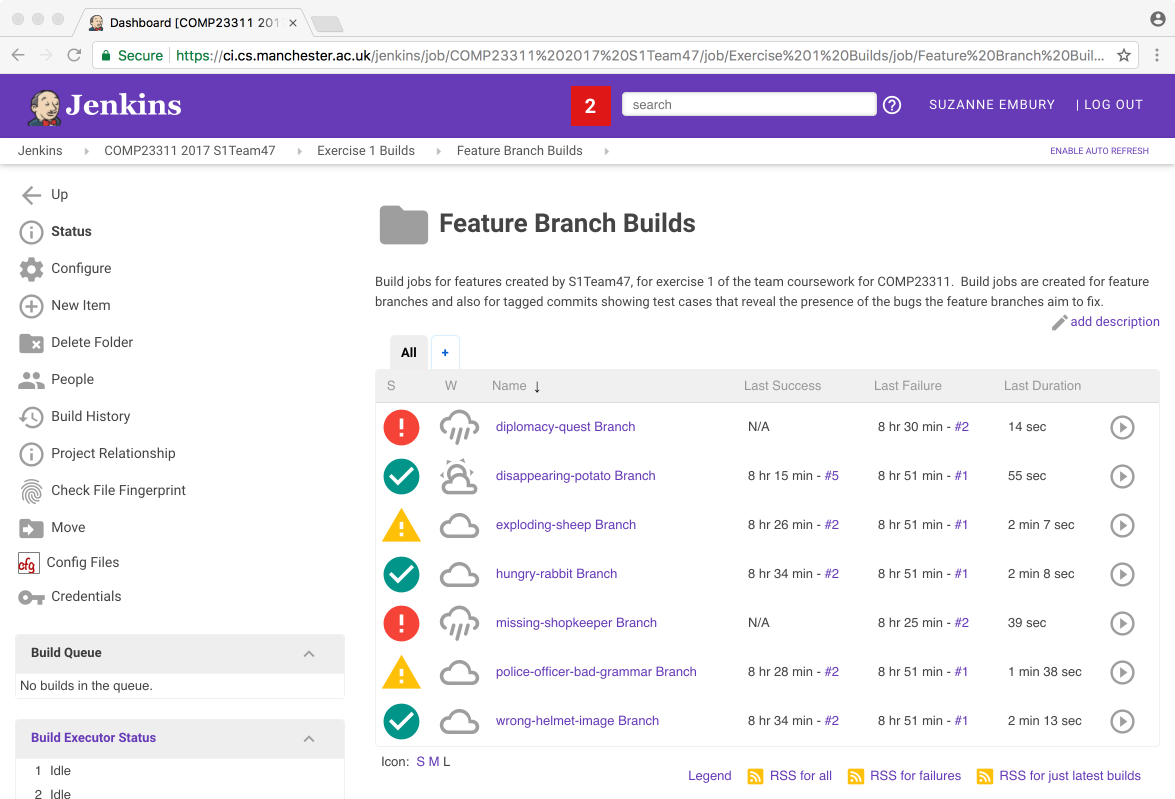
Figure 22.8: Jenkins view of the feature branch builds
As you can probably work out for yourself by now, this folder contains a whole collection of different builds. Team 47 is working on a different set of issues from your team, and therefore is working with different branch names from the ones in your team’s builds. But the overall organisation should be similar for your own team. There should be one build job set up for each of the feature branches we have asked you to create. The feature branch builds should be stable because they should compile and (since by the deadline they need to contain code that fixes the bug) they should pass all the tests.
You can drill down into any of these builds to get more information about the build, and information about what caused any failed or unstable builds.
The second set of builds are in the Issue Revealing Builds folder. If you navigate down into that folder, you will see a set of builds looking something as in figure 22.9.
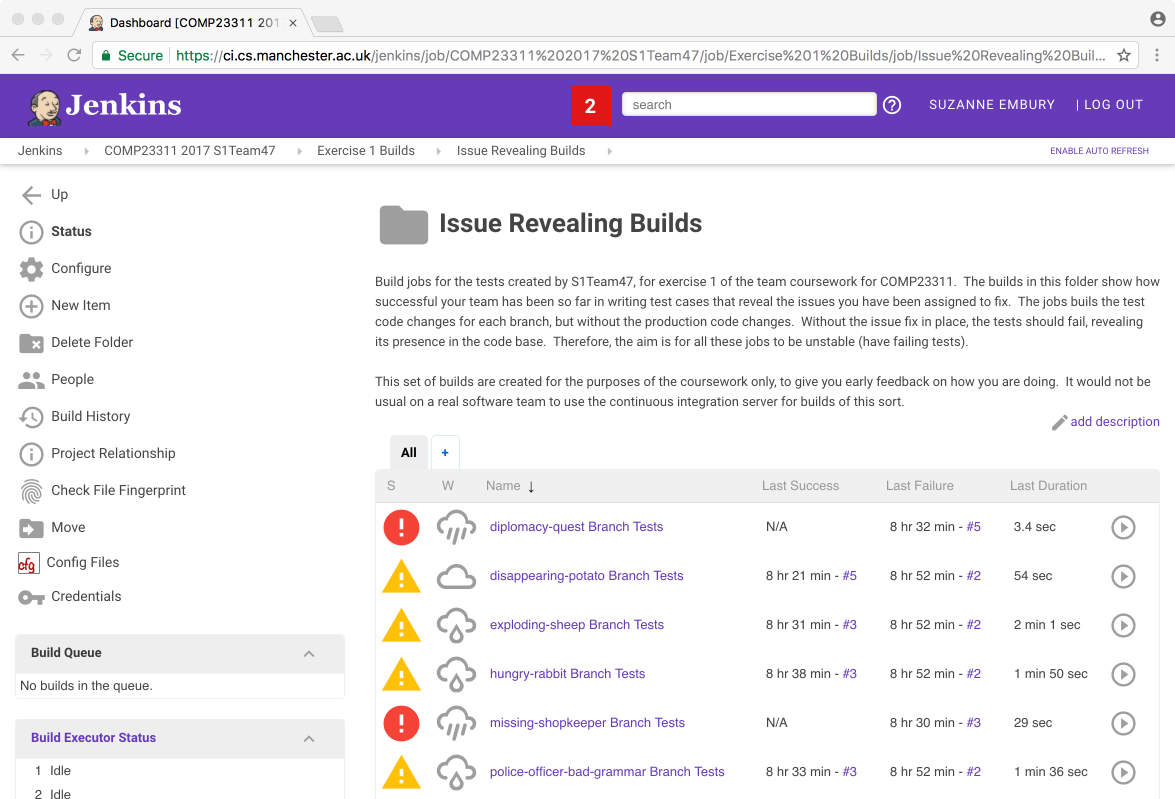
Figure 22.9: The Issue Revealing Builds folder in Jenkins
These builds are a little unusual. Their job is to run the tests on a code base consisting of the production code from the start of the exercise (i.e., the code that does not contain your fixes) and the test code from your feature branch tip (i.e., the code that contains the tests you wrote to reveal the issue). This means that we expect these builds to be unstable. We want to see the tests failing, so that we can see that the issue is properly exposed by them. To be fully sure you have revealed the issue correctly, you’ll need to drill down into the build and take a look at the tests that are failing. Ideally, these should just be the tests you have written to reveal the issue. If some other test cases are failing as well (or, worse, instead of) your new test cases, then your final mark will be reduced.
Builds of this kind would not normally be created for a real software team. We have provided them to help you track your own progress towards the goals of the coursework, and to help us in marking your tests fairly and accurately.
Note that all the builds in these two folders should be either stable or unstable by the deadline. There is only one case in which a failed (red) build will be acceptable in the released repository: when you have fewer people in your team than the number of bugs assigned. Each team is expected to fix one issue per person. For example, a 5 person team will be expected to fix only 5 of the issues provided. In that case, the builds for any issue left unfixed can fail without any marks penalty (since they will fail because the required branch and tag will not be present in your team’s repository).
22.7 Confused? Stuck? Need Help?
If any aspect of the Jenkins builds we have created for you are unclear, please come and get help from a TA or a member of staff during the team study sessions. If you meet the workshop attendance requirements, you are also free to e-mail Suzanne with questions outside the team study sessions.
The School’s CI server is administered by Chris Page. Technical faults and outages should be reported to him through support.cs.manchester.ac.uk.
Bugs or feature requests for the RoboTA system should be reported through the project issue tracker at gitlab.cs.man.ac.uk/institute-of-coding/robota-issue-tracker